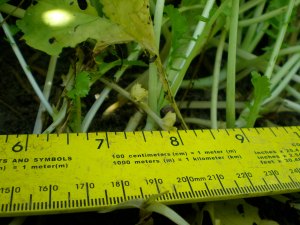
The field season is wrapping up. This week soil samples and penetrometer readings were taken at Adam’s Berry Farm. A penetrometer measures resistance as it is pushed down. It is used to indicate levels of compaction in the soil. Without doing a statistical analysis, at first glance the numbers trend towards higher levels of compaction in areas with forage radish. Take my query with a grain of salt, perhaps the penetrometer is reading increased compaction in the forage radish plots because the large diameter of the root is pushing soil horizontally and thus causing compaction. A plethora of research has shown that forage radish can increase infiltration after decomposition. However, in the interim it may cause a loss of micro and macro pores in the soil and increase compaction.

Penetrometer.
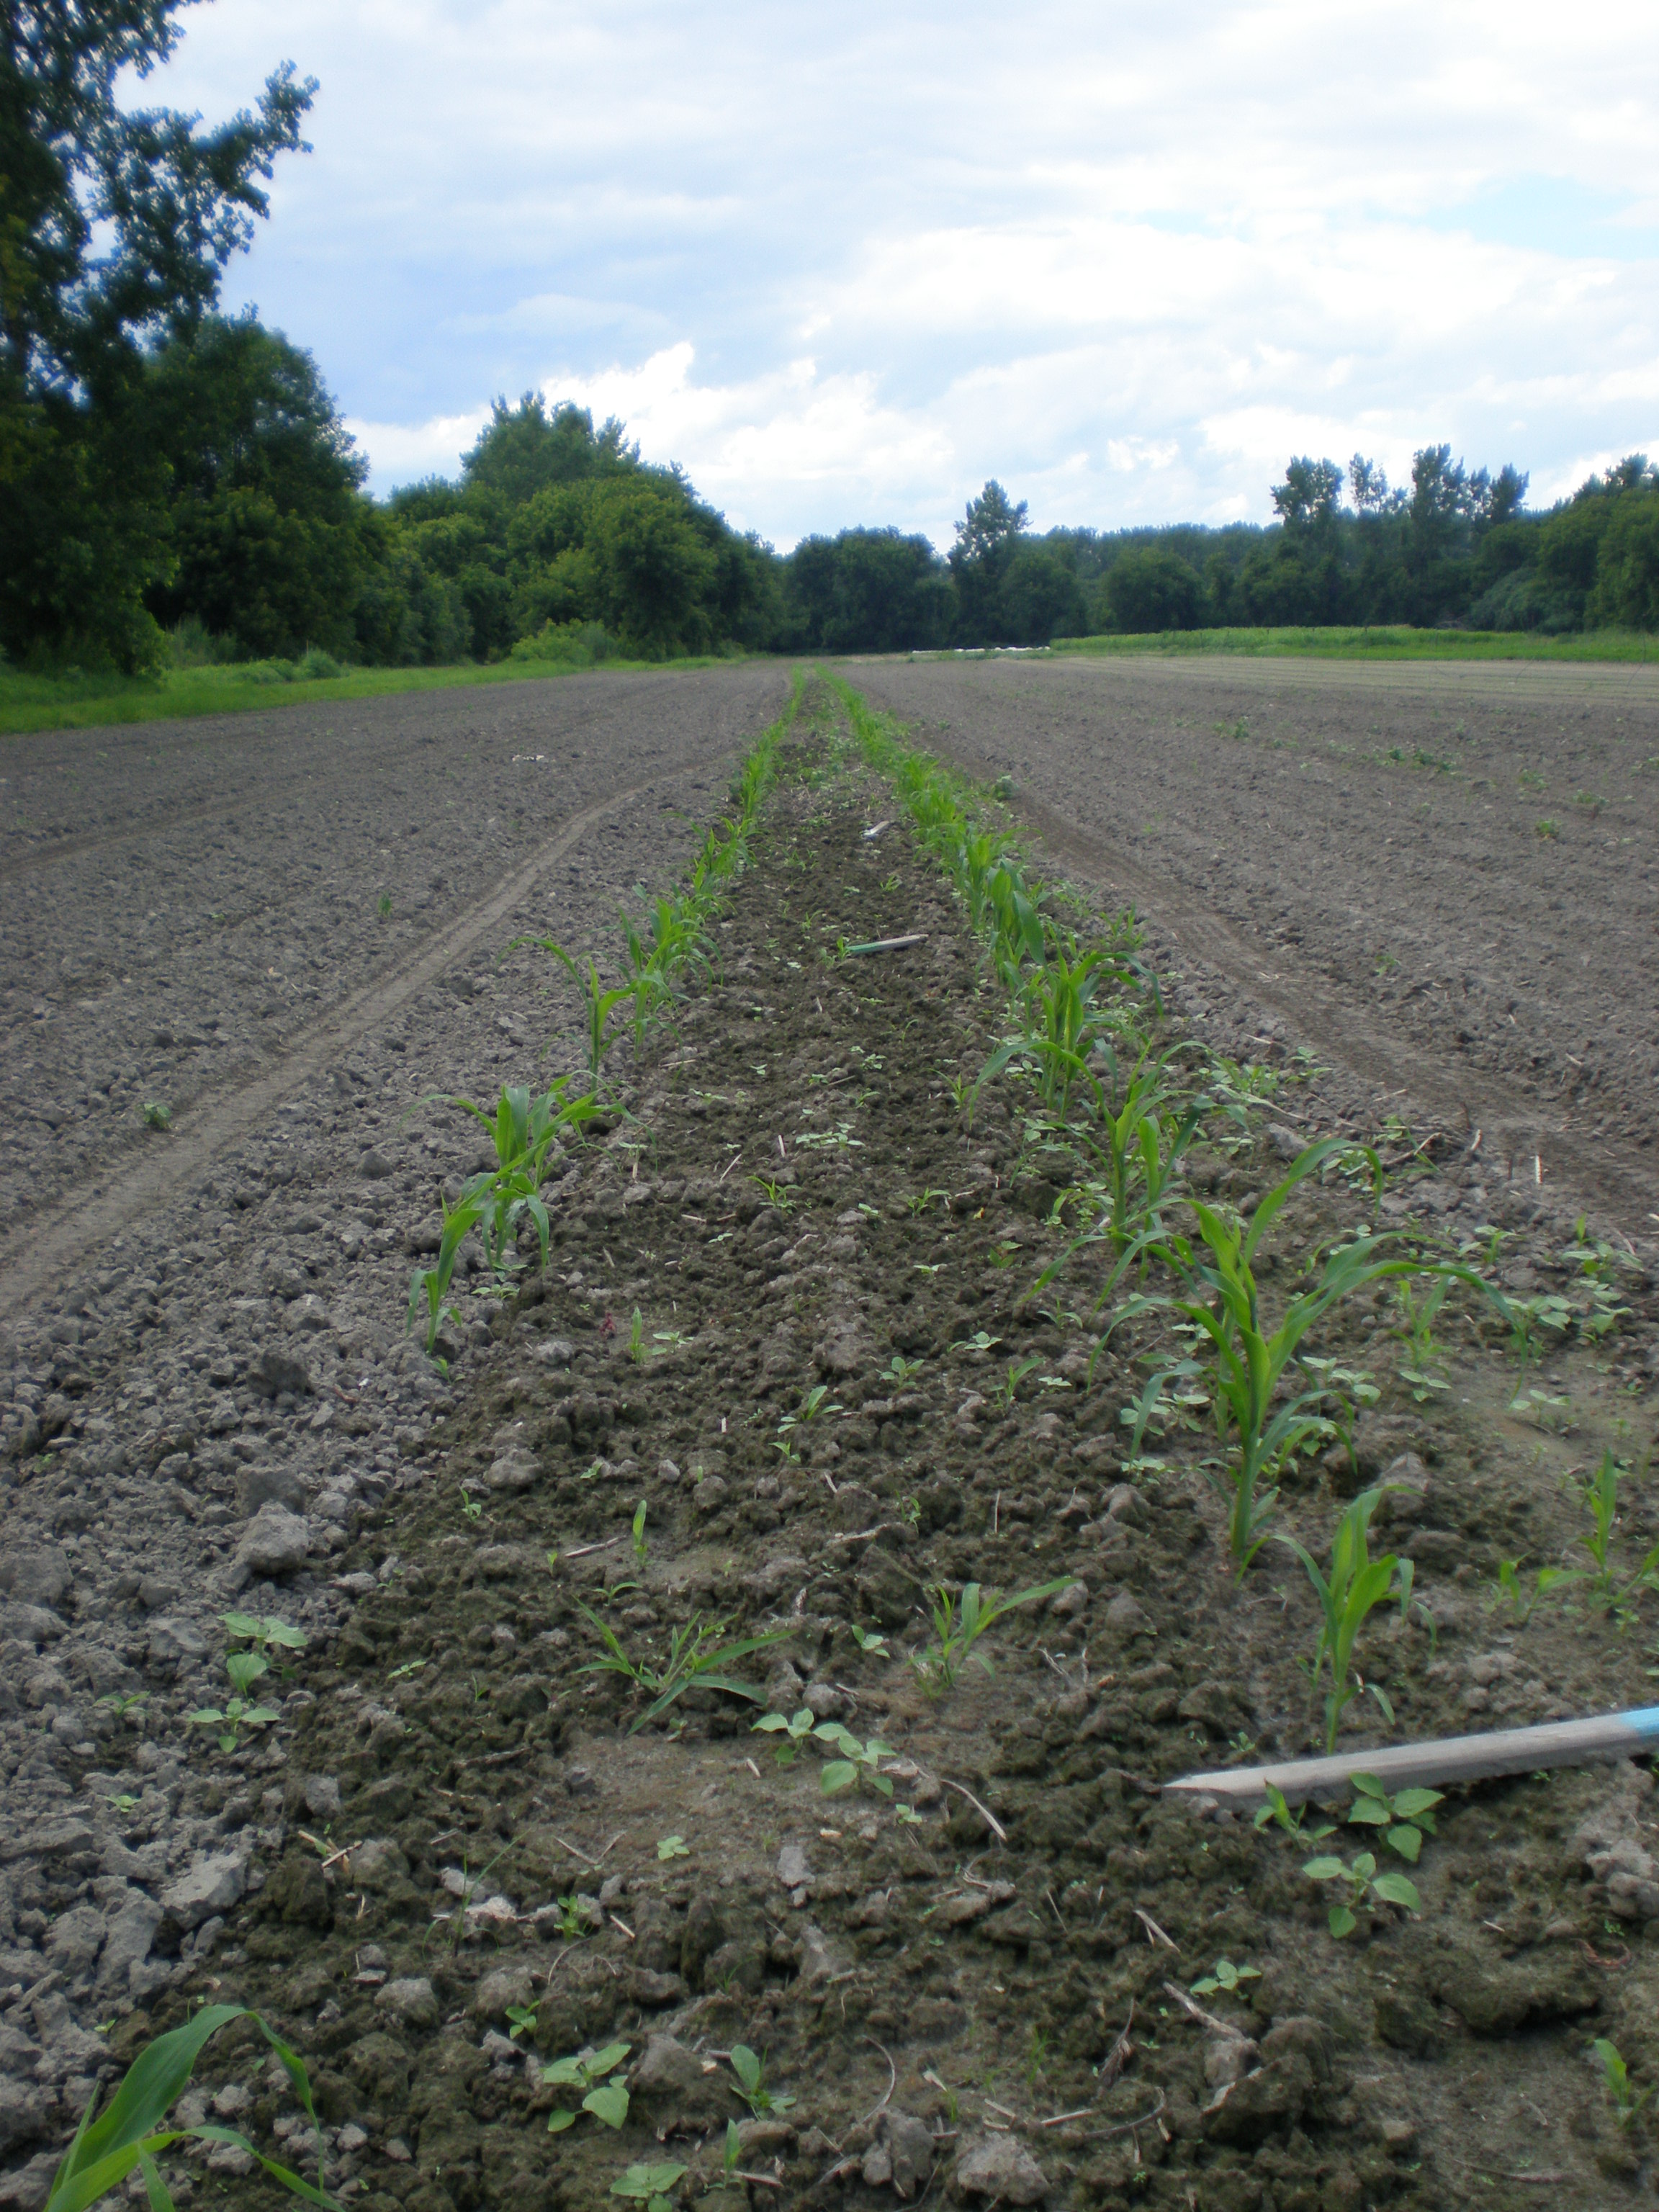
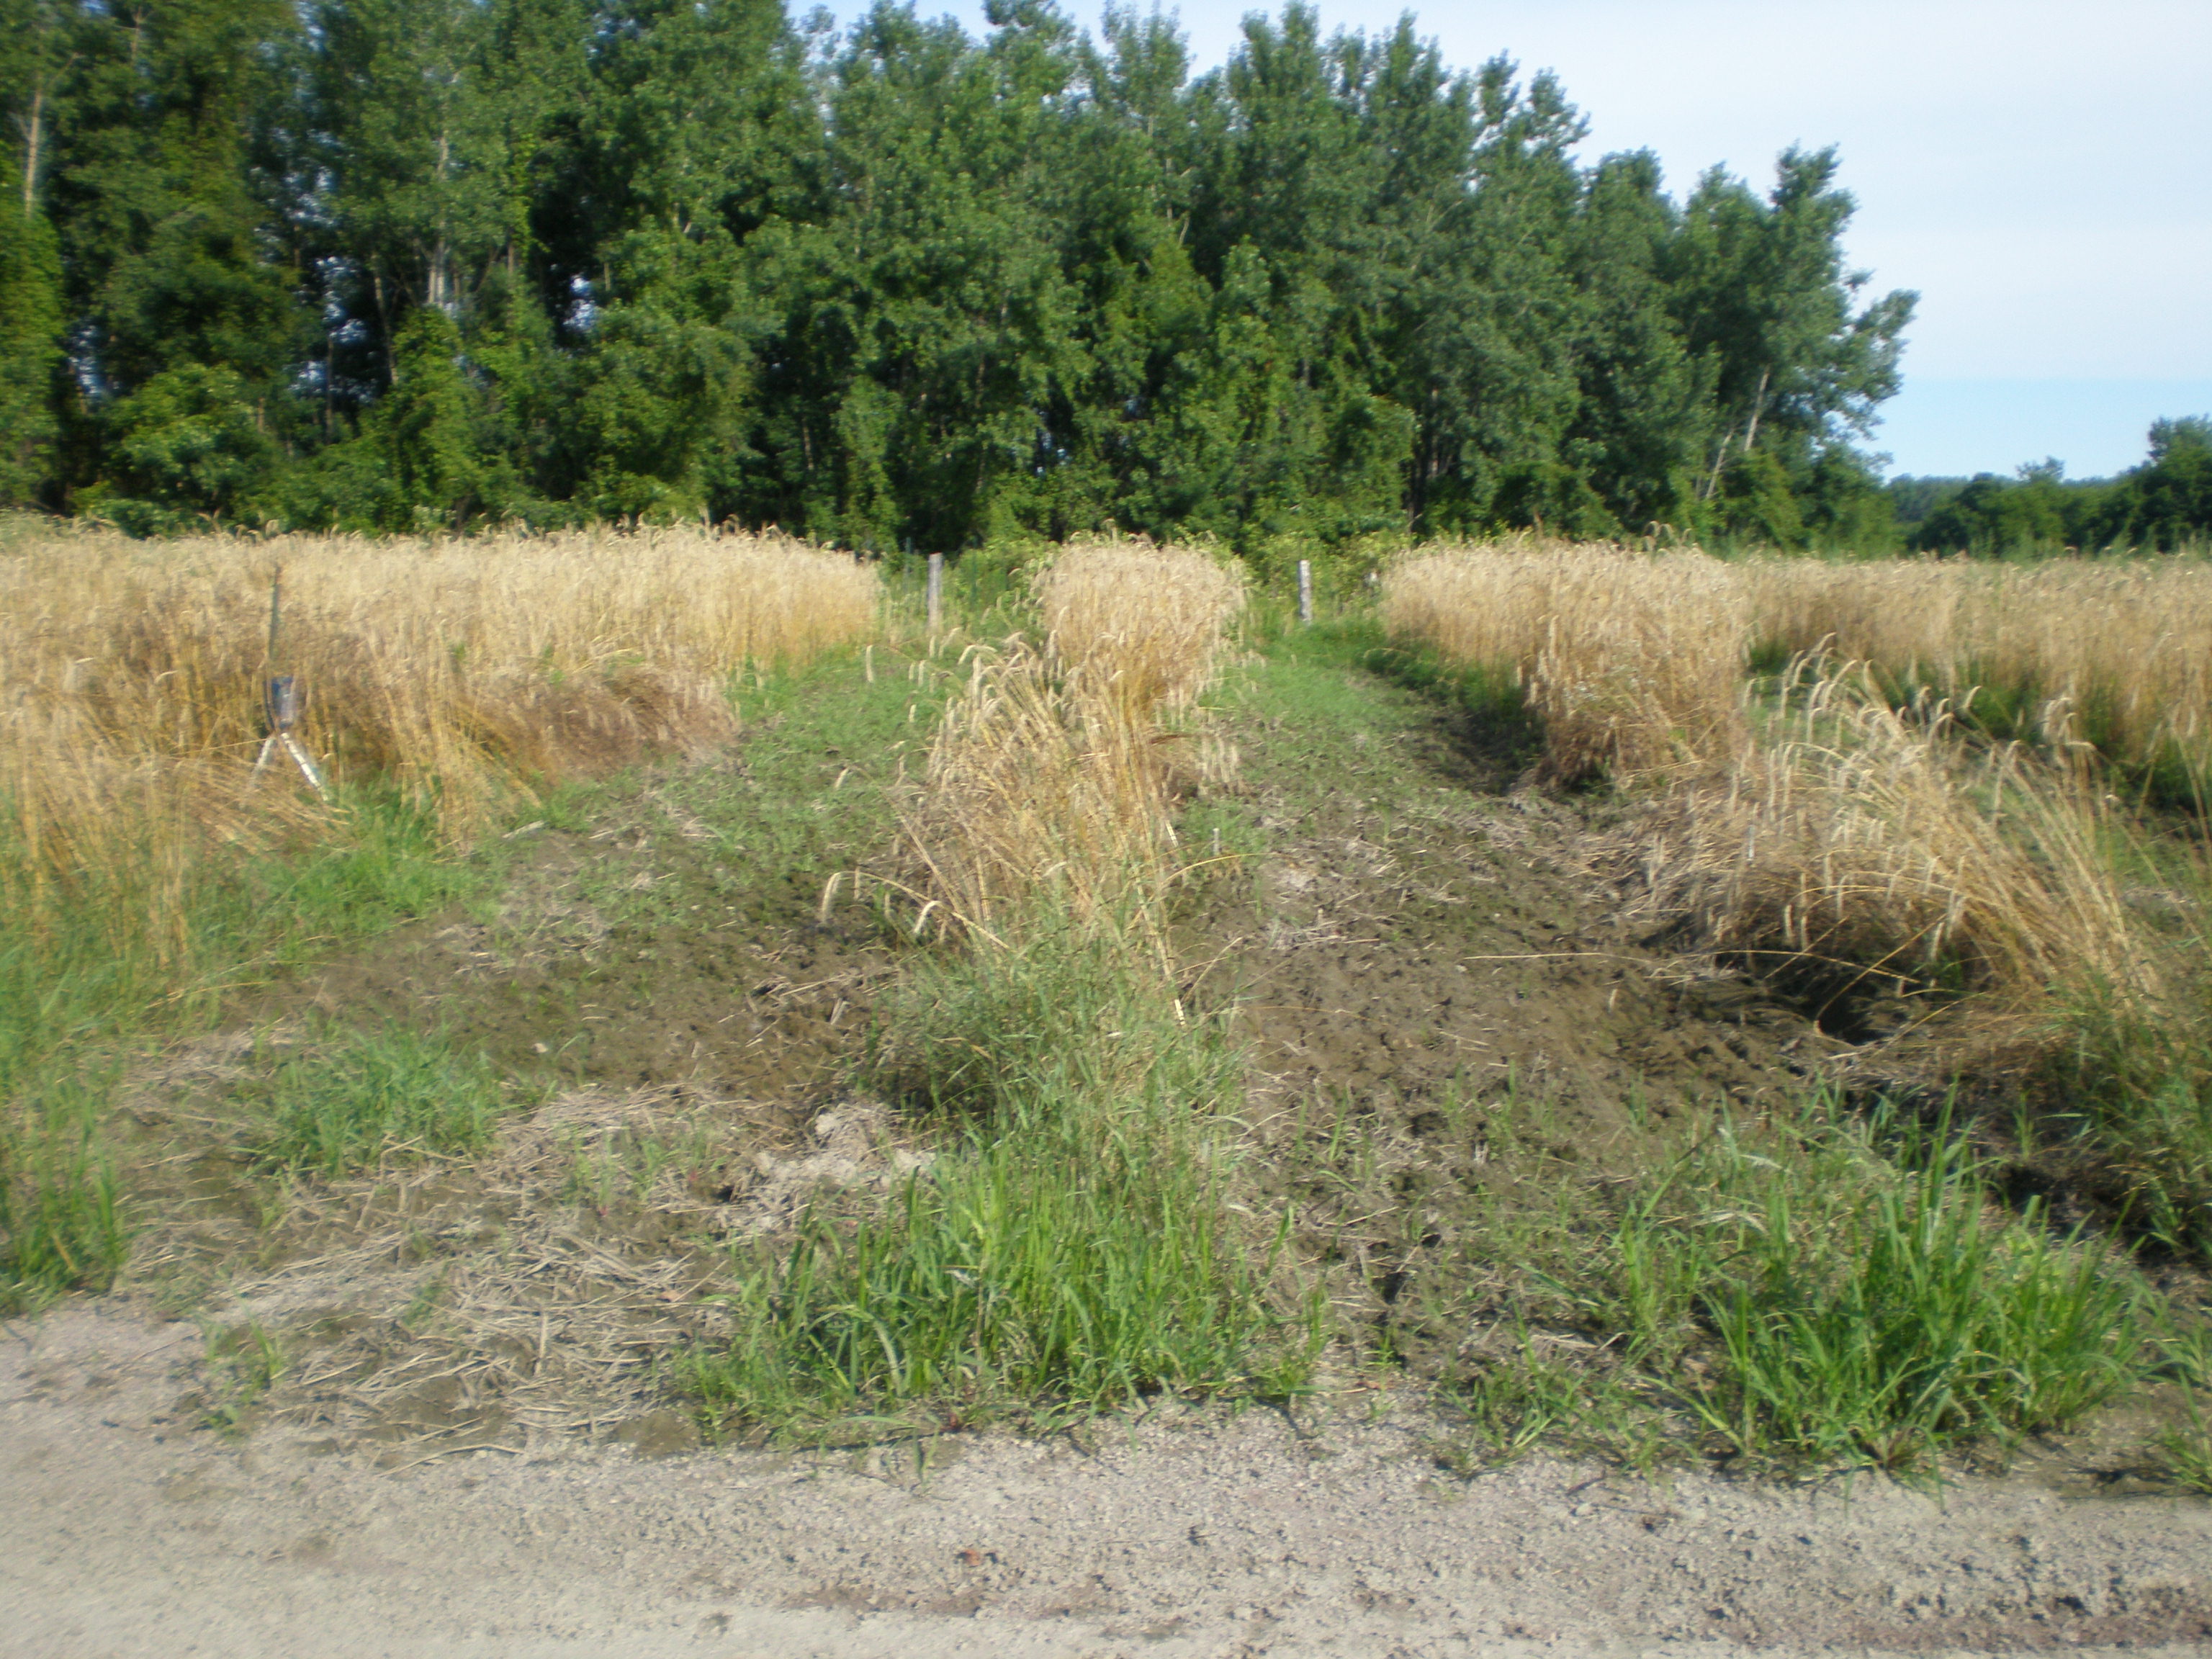
Seven weeks after planting, this is what Adam’s Berry Farm looks like:
There are six plots. The farthest three are difficult to see in this picture. The bright green on the right is forage radish, the middle darker green is winter rye, and the bright green is a mix of rye, vetch, forage radish, and lupine.
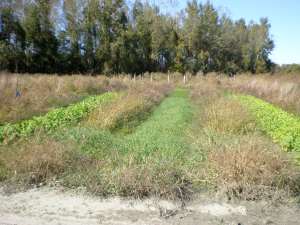
Adam’s Berry Farm, October 3, 2013.
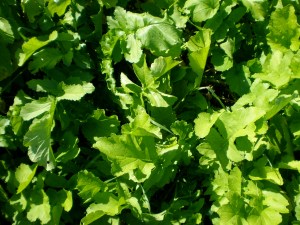
The lupine is farming a low-lying canopy.
Lupine.
The stand if vetch is filling in slowly. At about 2.5 inches, the vetch is nearly as high as the lupine.
The rye comes in second to forage radish for tallest of the six plots.
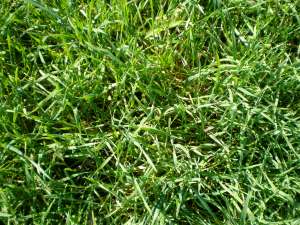
Rye.
One lone lupine is visible and slight numbers of vetch and rye are present. The mixed plot is dominated by forage radish. I am curious to see if the vetch and rye accelerate their growth as frost damage reduces the biomass of the forage radish.
Mix
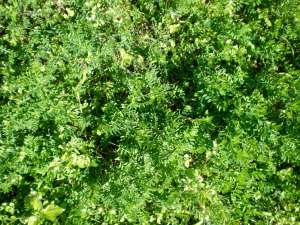
A few forage radishes on the edge of the forage radish and mix plots were quite large.
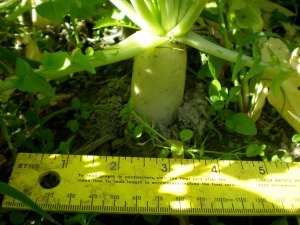
Large Forage Radish Up Close.
The forage radish in the middle of the plot was quite small due to competition for resources.
Small Forage Radish Up Close.
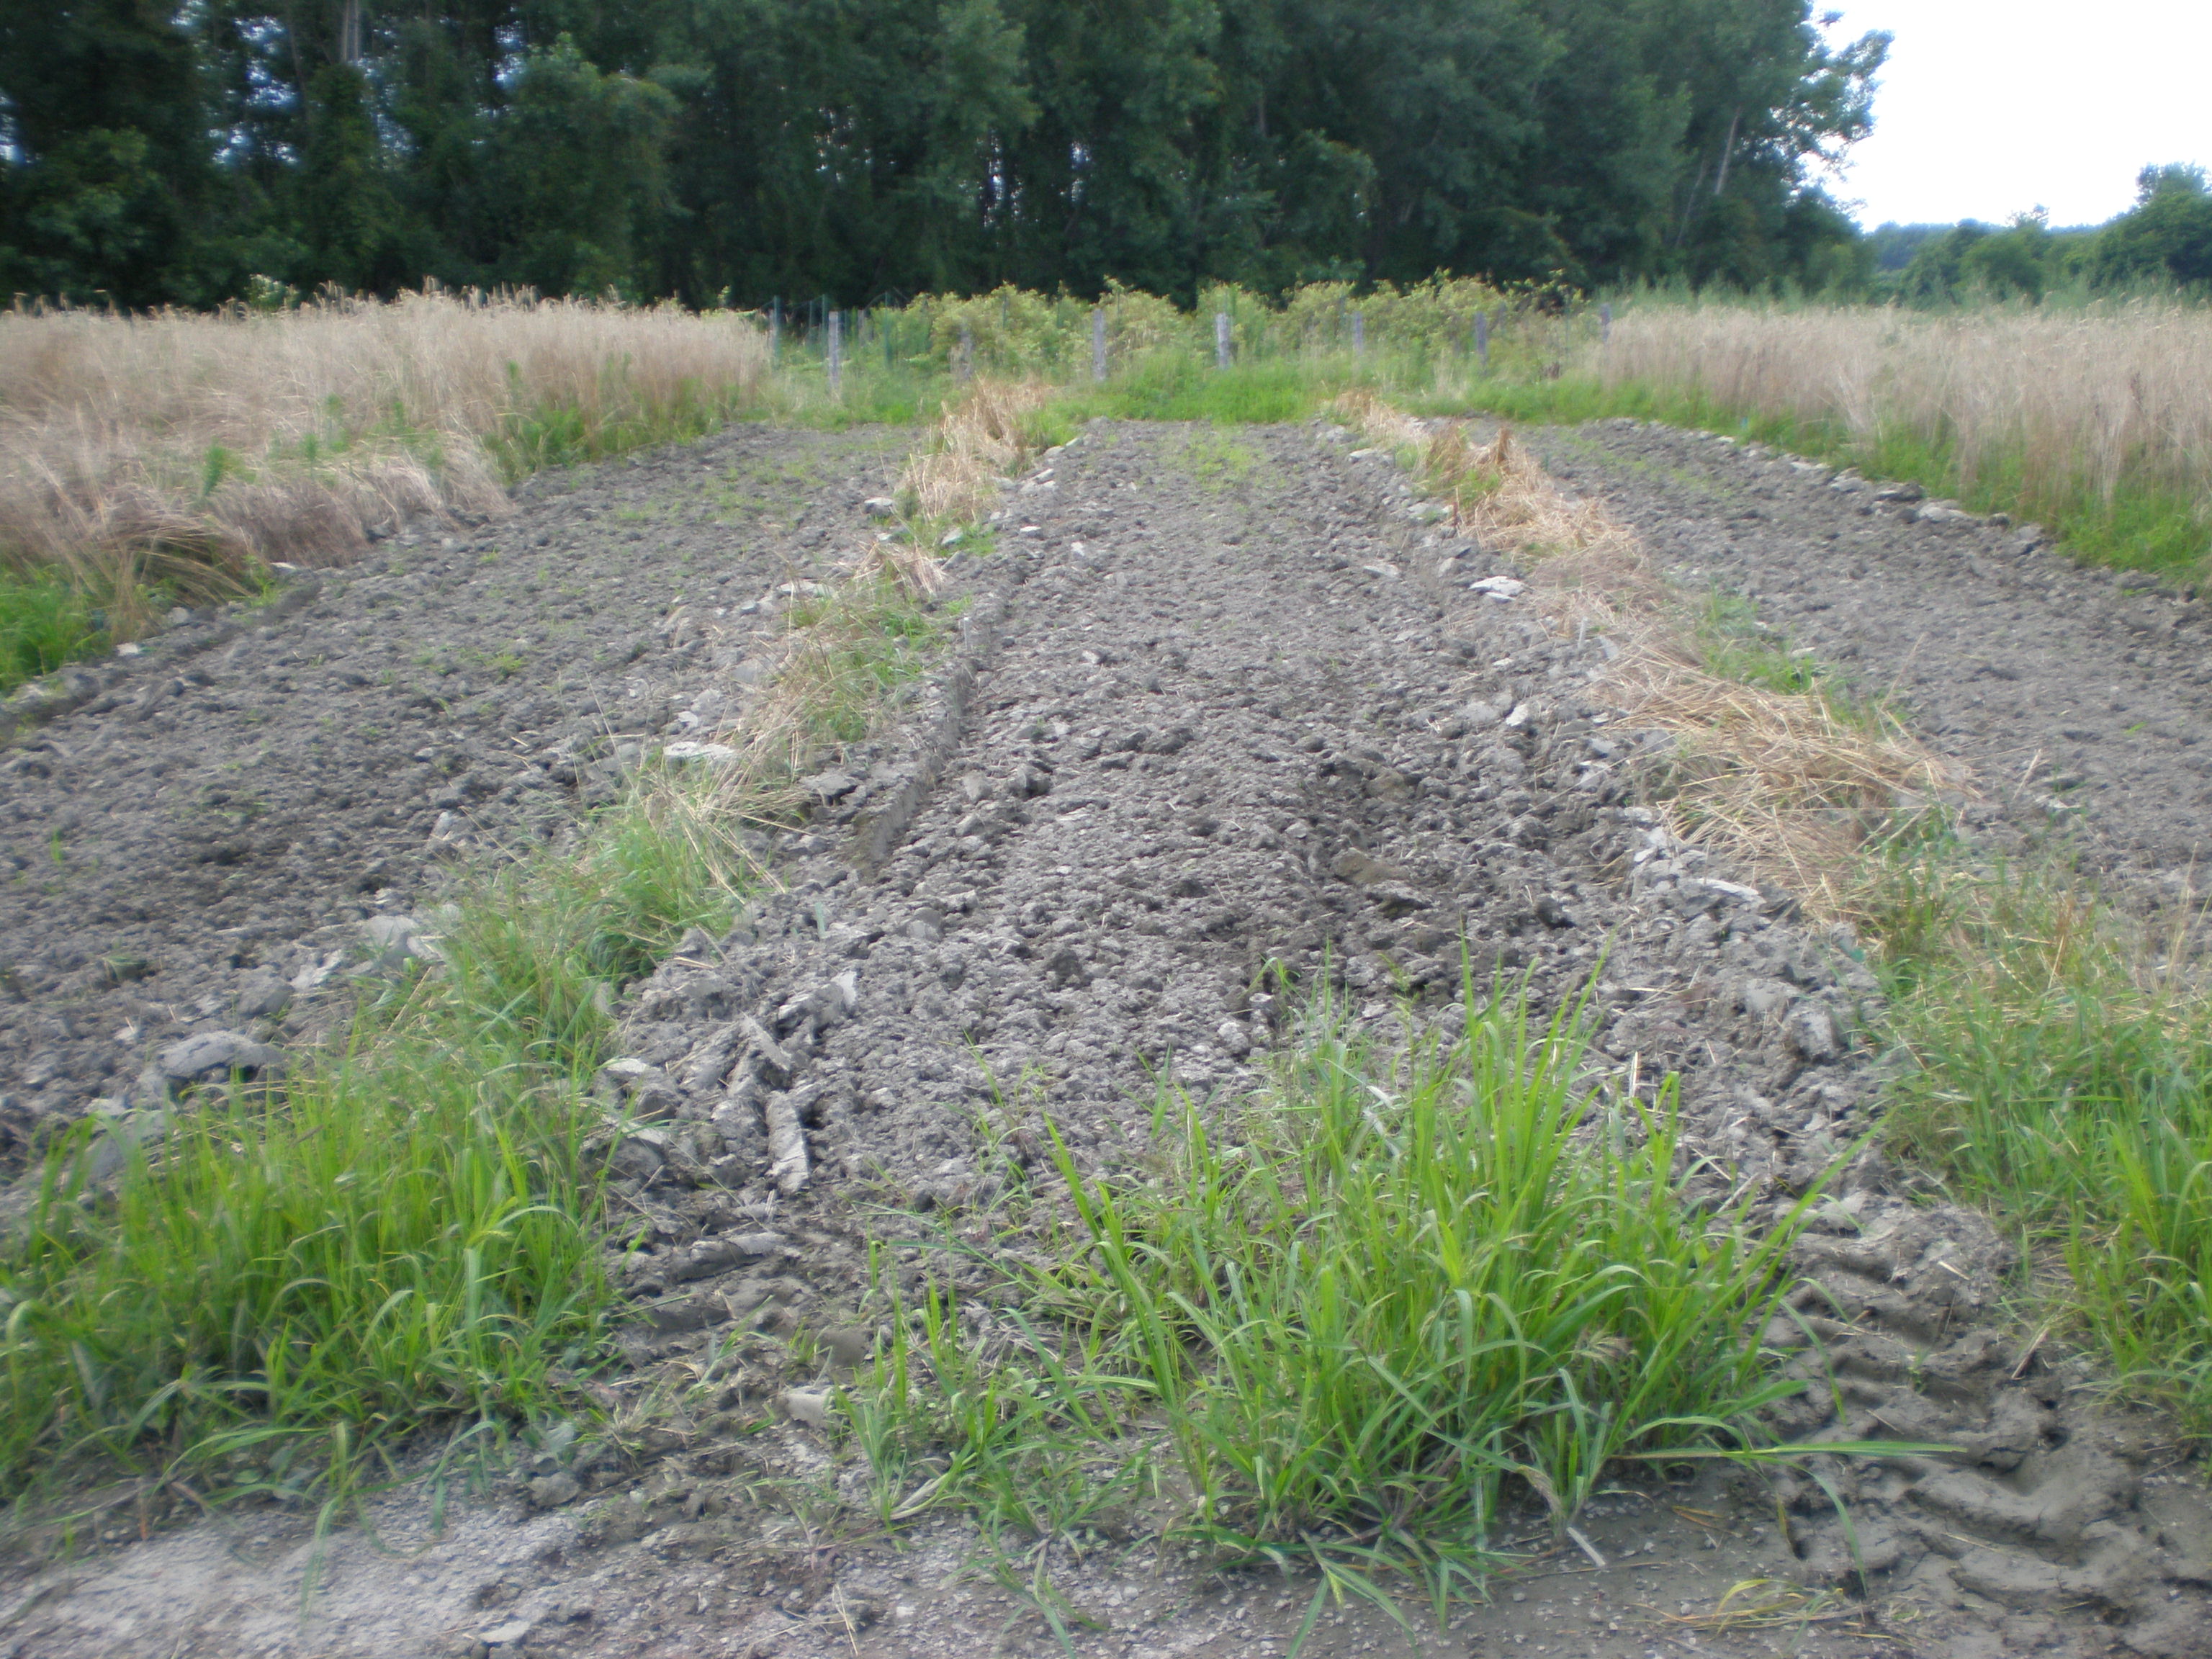
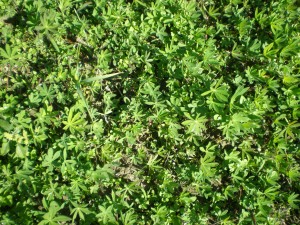
The fallow plot is overtaken with chickweed.
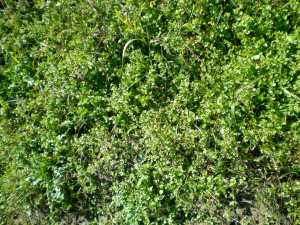
Fallow.